Angela Fan
huihuifan@college.harvard.edu
Visualizations labeled "static" are shown as images due to proprietary data concerns.
Fall 2014
D3 Animation Reel
Interpolated transitions between scatterplot, bar chart, and line graph. As seen at AARC Cancer Conference, 2015.
Fall 2014
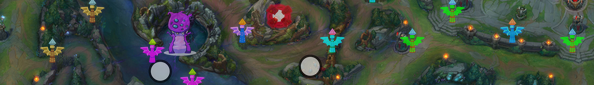
League of Legends Interactive Map
Learning tool for new players to explore League of Legends, displaying ward spots, gank paths, and jungle information.
Fall 2014
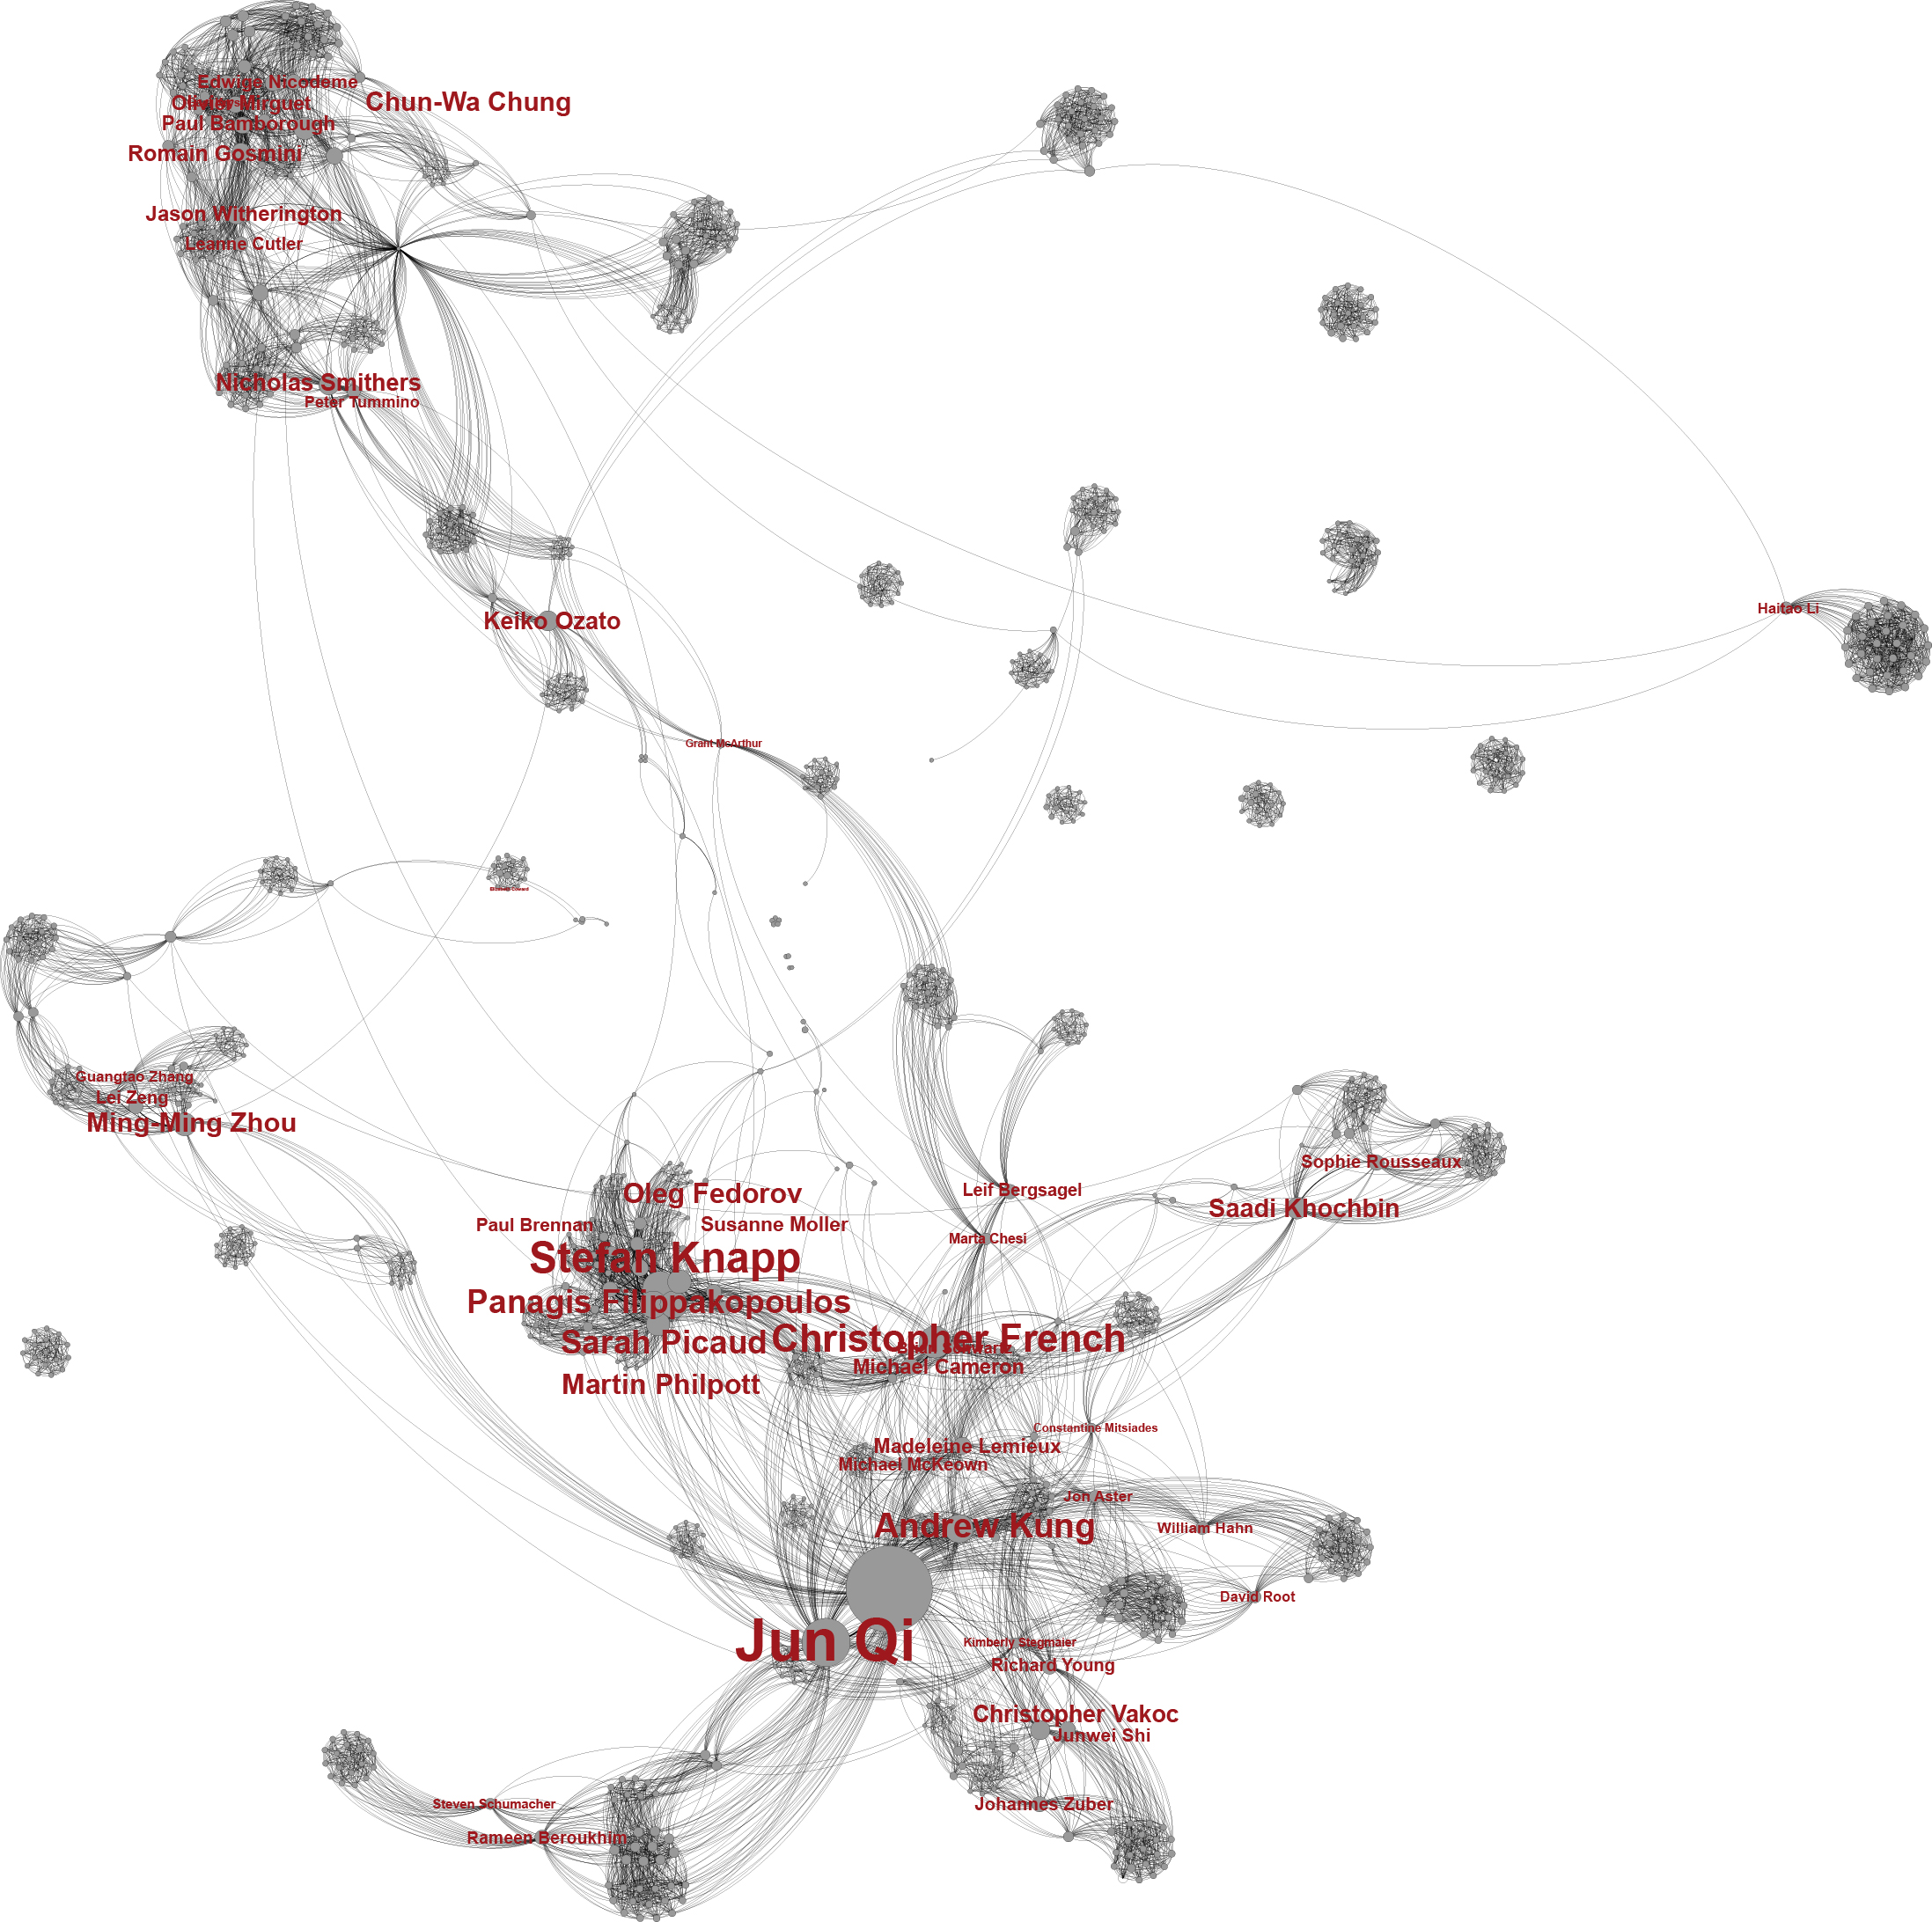
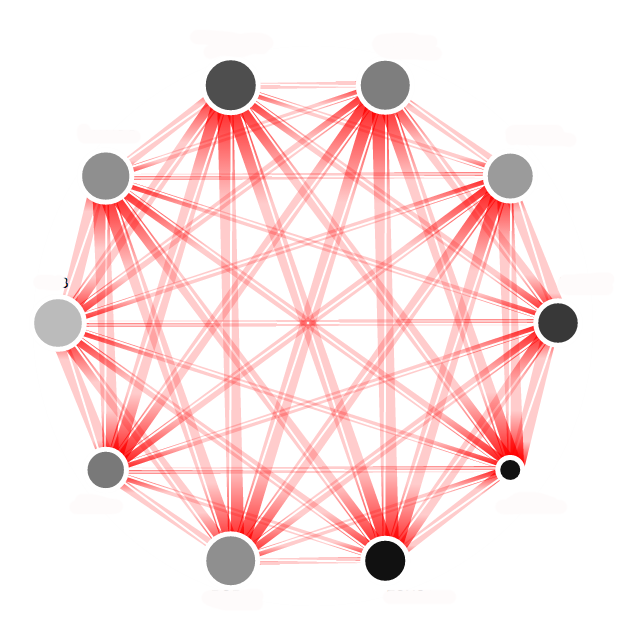
Scientific Collaboration Network
Force layout with curved edges, node labels. Based on manuscript co-authorship. Created for Harvard-MIT Art Expo.
Fall 2014
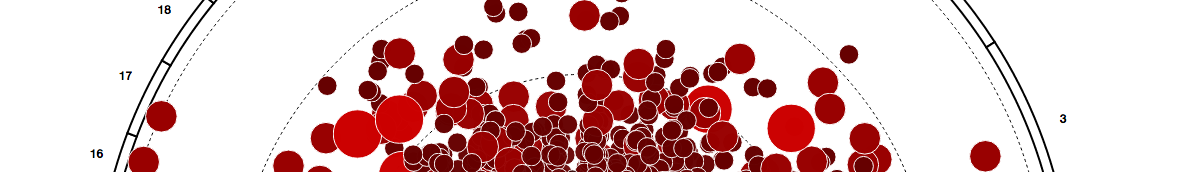
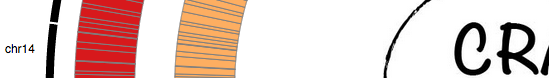
Chromosome Circos Diagram
Displays important genetic measurements based on their chromosomal location.
Fall 2014
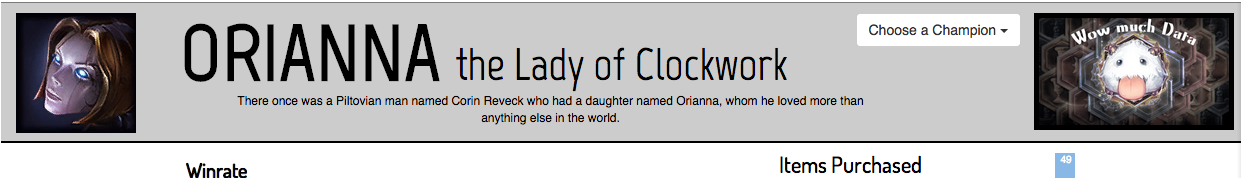
LOL Such Data
Interactive guide for new League of Legends players, created in 24 hours for Harvard Hackfest.
Summer 2014
Full Network
[static] Network with whiskering, tapered edges, and node attributes and labels.
Summer 2014
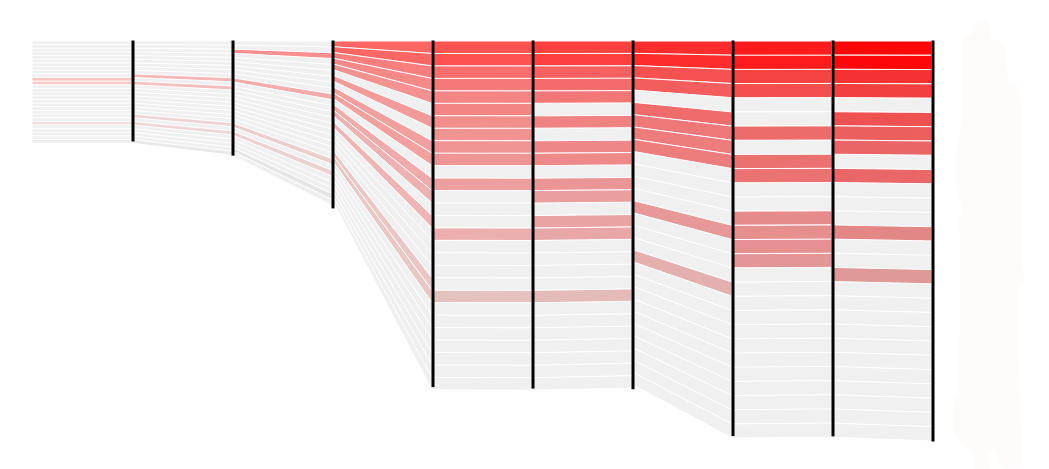
Streamgraph
[static] New take on classic streamgraphs inspired by Ben Fry's Isometric blocks.
Summer 2014
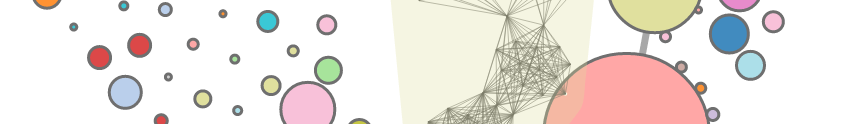
Co-authorship Collaboration Network
Interactive network with Louvain community detection, expanding hulls, and force minimized vibration.
Summer 2014
CRAVE
Interactive visualization of comparative genomic intervals of interest based on user-selected reference.
Spring 2014
Data Driven Dota
Individualized statistics for players of Dota 2 in the form of interactive graphs and filtering selections.
Spring 2014
d3 Circos
Interactive multi-ring Circos plots with top-k filtering.